6 The basics
6.1 What is R and why do I care?
What is R? R is the 18th letter of the alphabet, the fourth letter in QWERTY—like the keyboard—and, most importantly, R is a software package for statistical computing.
First, a brief history lesson. R is a descendant of the S statistical programming language whose naissance can be traced back to 1976 in Bell Laboratories.25 As S developed, people sought to commercialize the language. In 1993, the license as well as development and selling rights were given to a private company. From then on S became available only as the commercialized S-PLUS.26
Later, seeing a need for an improved statistical software environment, two researchers from the University of Auckland created a new statistical programming language. This became known as R. R was developed in the image of S. Because of this S code should be able to run as R code. However, an early decision to make the R (also referred to as the R-project) free and open source changed its fate dramatically.
Today, the R-project is developed and maintained by a group known as the R Core who “represent multiple statistical disciplines and are based at academic, not-for-profit and industry-affiliated institutions on multiple continents”27. They define R as “an integrated suite of software facilities for data manipulation, calculation and graphical display.”28
R is in essence a very fancy calculator. It was designed to do math—specifically statistics—but its capabilities extend well beyond basic mathematics. While R is for all intents and purposes a programming language, one should, in theory, feel like they are doing data analysis and not programming.29
R is unique amonth other commercial statistical software such as Stata and SPSS. Very fundamentally, R is a free project. While it is monetarily free, free refers to “liberty, not price.”30. I think it is important you familiarize yourself with the four freedoms of free software. These freedoms are listed below from one to four, though are referred to as freedoms 0 through 3.
They are:
- The freedom to run the program as you wish, for any purpose (freedom 0).
- The freedom to study how the program works, and change it so it does your computing as you wish (freedom 1). Access to the source code is a precondition for this.
- The freedom to redistribute copies so you can help others (freedom 2).
- The freedom to distribute copies of your modified versions to others (freedom 3). By doing this you can give the whole community a chance to benefit from your changes. Access to the source code is a precondition for this.31
These freedoms are a large part of the success of R as a language. Because of the free nature of R, academics and industry experts from around the globe are contributing to the language. This means that many new statistical techniques are first implemented in R.
The contributions that people make to R are changing the ways in which people perform data analysis. Because of this, we need to start to understand the tooling we use as part of the scientific process—not apart from it. When you engage in your analyses and contribute to the scientific literature, remember that without the tools you are using, much of it would not be possible. When you engage in science, think to yourself how you are adhering to the four essential freedoms. Are you enabling others to do with your findings as they wish? Will your research be accessible to the greater community? What will you do to “give the whole community a chance to benefit from your [work]?”32
6.2 The RStudio IDE
When R is downloaded, interacting with it requires a fair amount of computer science know how. While some people love it, it can feel like programming in the matrix.
For this reason, we will use RStudio to program in R. RStudio is an integrated development environment (IDE). This means that most of the features that you will need to develop in R will all be in one place. RStudio gives you a place to write your R code, execute it, view the graphics you produce, and much more.
I like to think of R as the English language and using RStudio is like using Mircrosoft word. Chester Ismay and Albert Kim’s book Modern Dive, provide another excellent analogy of R and RStudio. They describe R as the engine of a car, and RStudio as the dashboard.33
In RStudio there are four quadrants that we work with which are called panes.
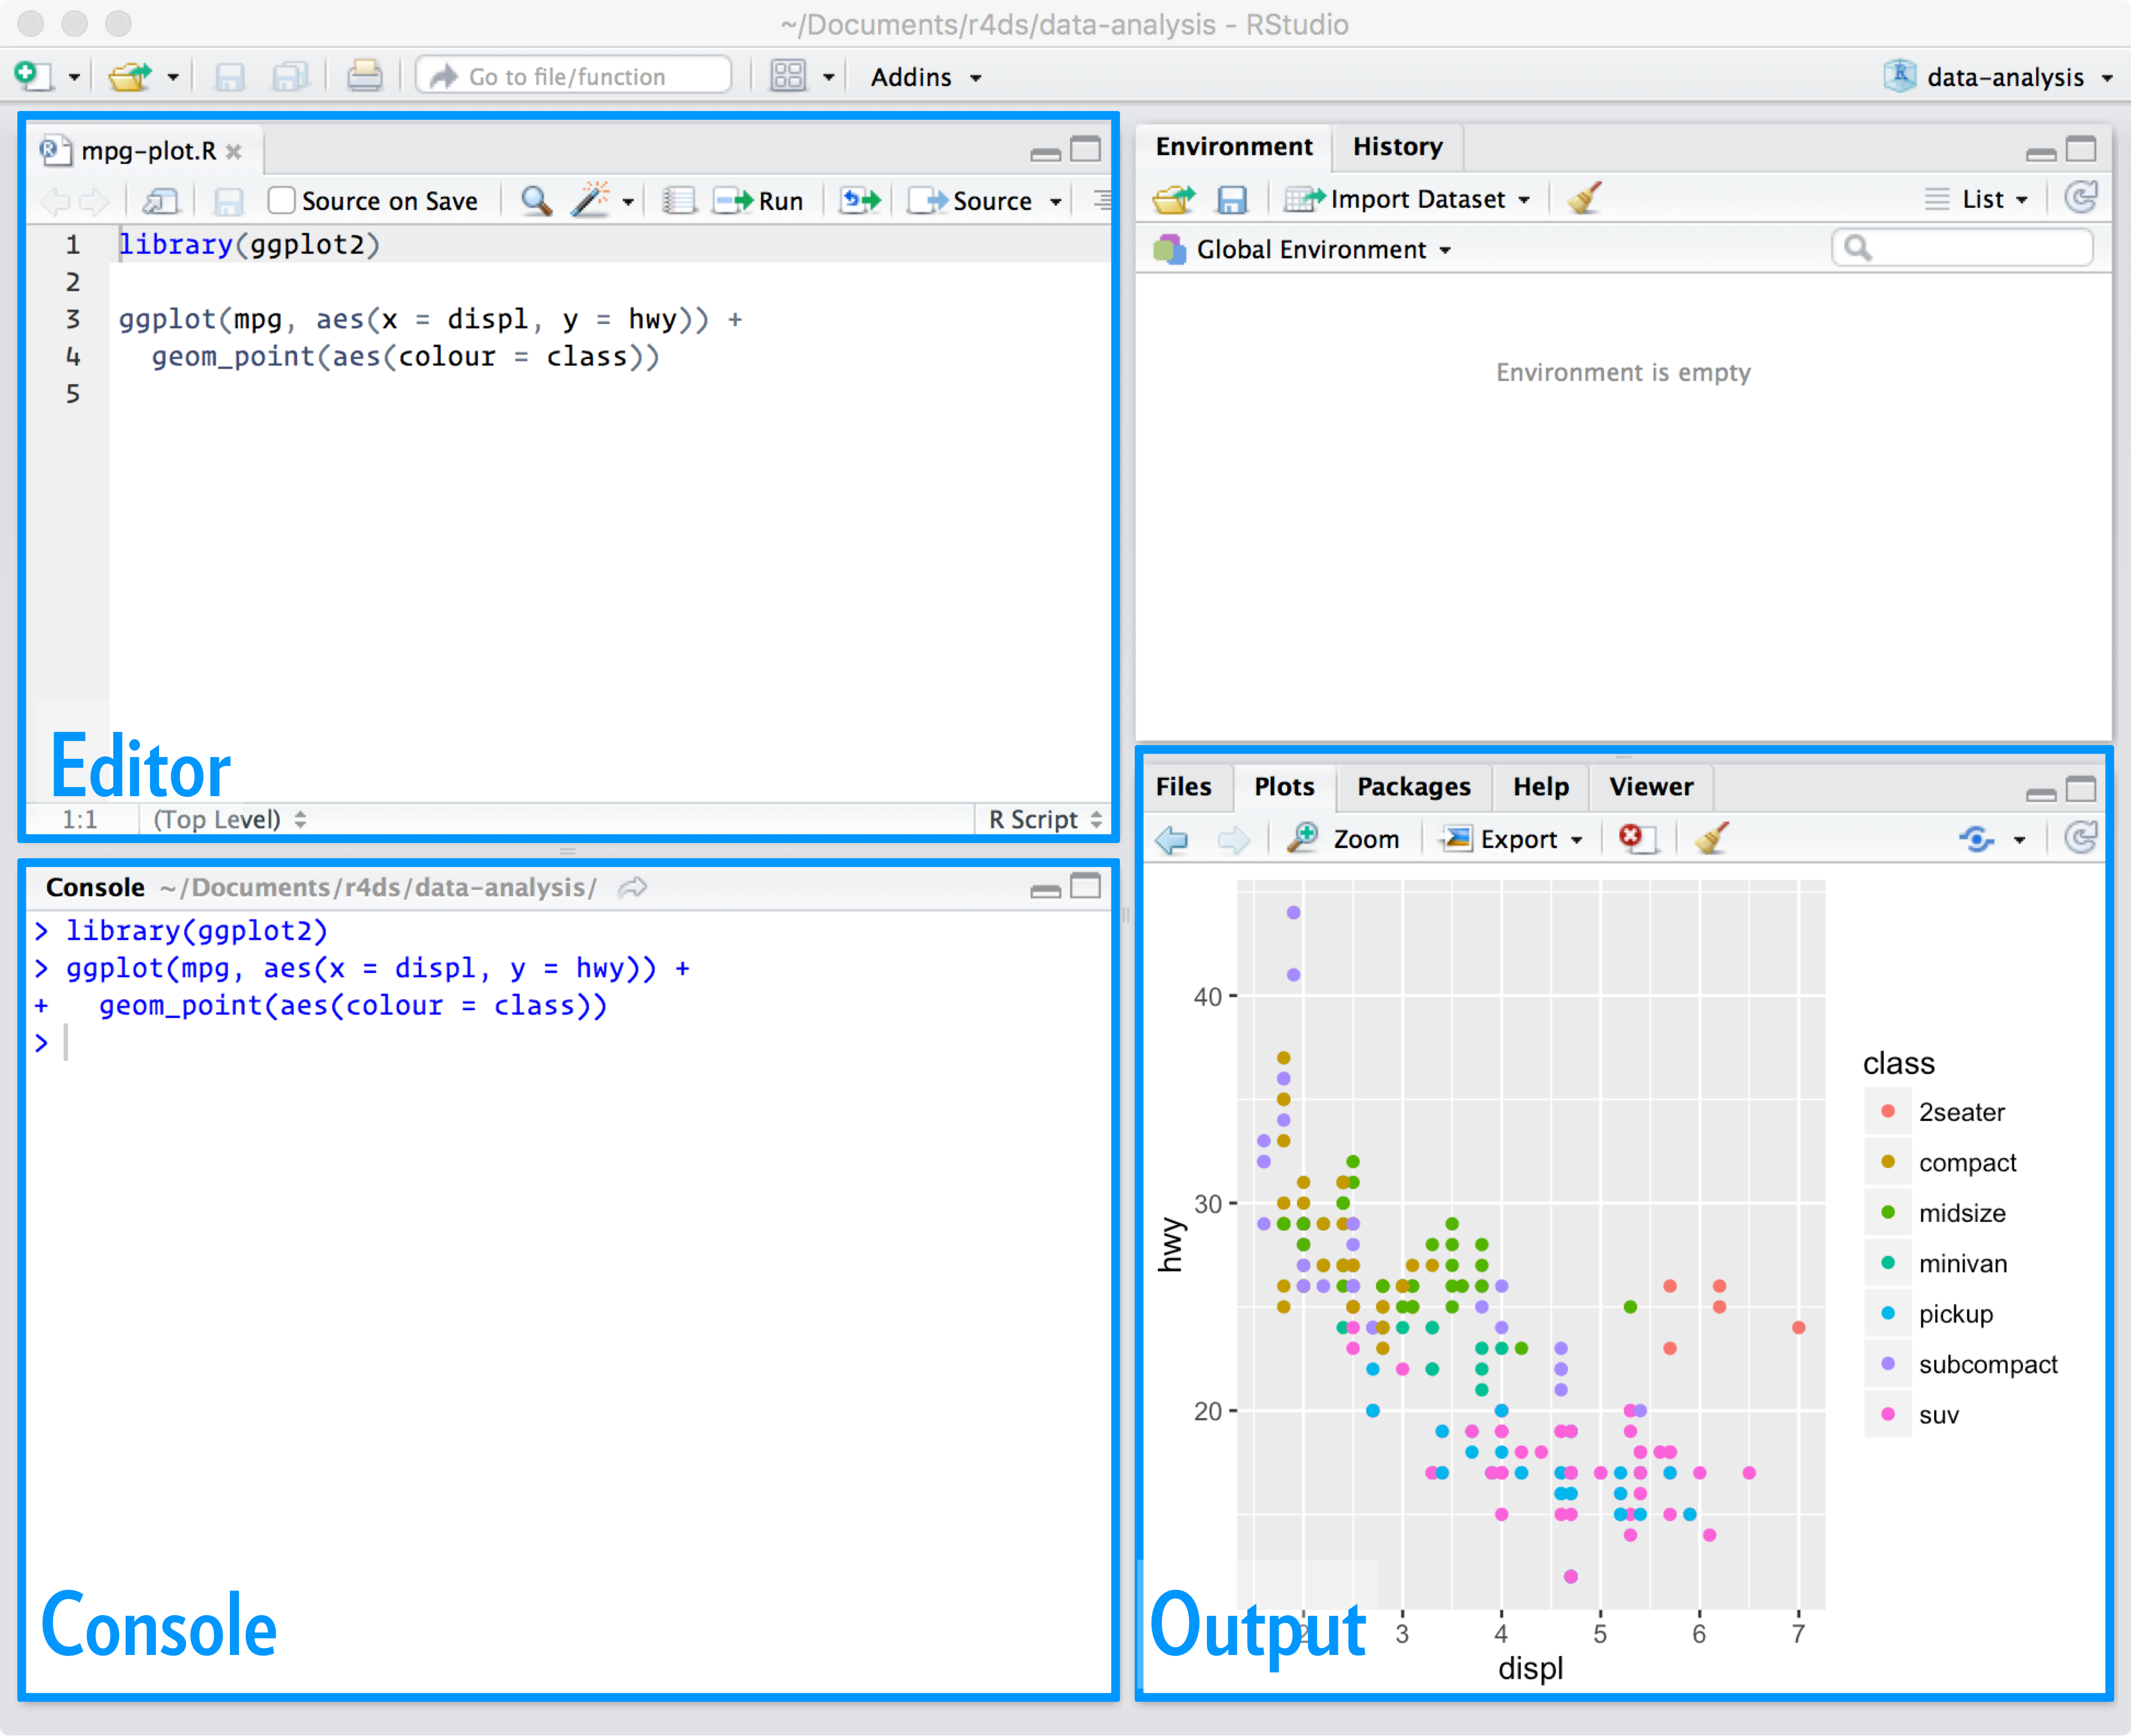
The above graphic is borrowed from RStudio, PBC’s Thomas Mock’s Introduction to the Tidyverse.34
6.2.1 The Editor
The top left pane, this is where you will actually write your code. You will see in the image above that there is tab with the name of the R file being edited, mpg-plot.R. The simplest way that R code is written, is in documents with the .R extension. Files with the .R extension are called “scripts.” They, like a movie script, list the order that lines—in this case, lines of code—occur. Think of the R script as your word document. This is where you put the writing that you want to keep.
There is also a second type of R file called an R Markdown document, .Rmds. These are a special type of file that lets us intersperse regular prose with code chunks. Rmd is extremely flexible and enables the user to render their content in many different formats such as a PDF, PowerPoint, HTML, and others. For example, this book is written with R Markdown. But, to keep things simple, we will use R scripts for the vast majority of this book.
6.2.2 The console
The bottom left pane is the console. The console is where your R code is actually executed. When you run a line or chunk of code from your editor, you will see it processed in the console. I often treat my console as my scratch paper. This is a place where I can explore R objects and code without affecting the primary R file. You should become comfortable typing your R code in the editor and seeing it executed in the console.
6.3 Installing R & RStudio
Now that you are somewhat familiar with R and RStudio, it is time to install them. I recommend installing R first.
R can be downloaded from the Central R Archival Network (CRAN).35 CRAN is the official location for all things R. CRAN provides access to the R software, license, copyright, and software extensions (called R packages).
RStudio is provided by RStudio, Public Benefit Corporation (RStudio, PBC). To install RStudio navigate to the download page.36 Once both have been installed you can open RStudio to get started. Look for the circular R logo. If you get lost navigating the RStudio IDE, be sure to refer to the cheat sheet.
6.4 Preventative Care
6.4.1 R Projects
Once you open up RStudio you will be able to get rolling. This following section will save you and anyone you collaborate with an indescribable amount of headaches. Many users are tempted to open up RStudio and begin doing analysis. We need to contextualize each and every analysis as it’s own project. If there is a common overarching theme, intent, or purpose, that analysis should be delineated as its own project and should be identifiable from others.
You probably already have projects in your life. Consider your school work. Suppose you have organized a folder structure where each semester is its own folder, and each course is its own folder within that. An example of what some of my folder organization looks like is below.
fall/
  big-data-for-cities/
    projects/
  urban-theory/
    literature/

spring/
  info-design/
    data/
  intro-data-mining/
In the above case we each course is its own project. The important thing to keep in mind here is that each project is self-contained. By working inside of self-contained folders we can ensure that there are no problems accessing files. R uses the concept of a working directory. The working directory is the place where R starts from when looking for files.
Imagine R is using the working directory spring but you are working on your info-design work. You would be under the impression that you were working from the info-design folder, but R would believe you were working from spring. So when you try to load some data from the data folder inside of info-design (which looks like info-design/data), you have to tell R how to get there. The instinctual path would be data but R is actually expecting info-design/data.
To prevent this we can create an R project. An R project imposes the standalone structure that we will need to prevent the above issue.
The way to create a new project is by navigating to File > New Project.
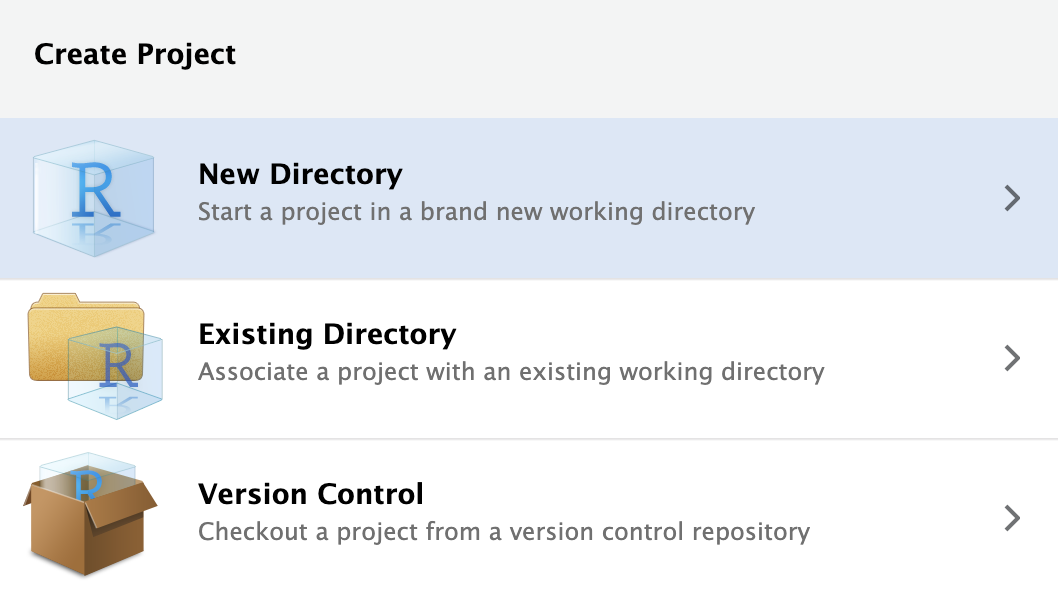
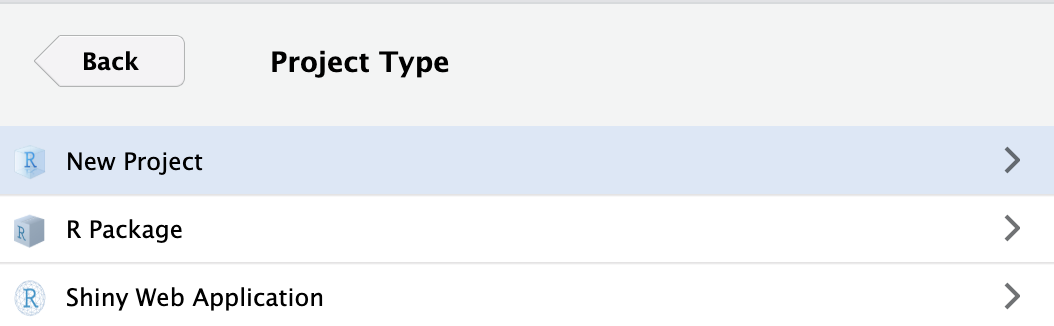
Click New Directory. This will create a new folder for you. Next, RStudio will prompt you to specify what kind of project to create. Today, that will be a generic New Project. In the future, I suspect you will end up creating Shiny applications and much more.
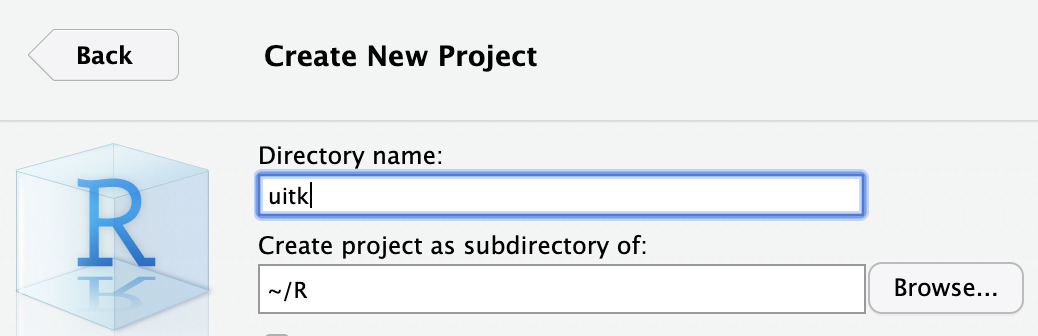
The final step is to specify what the project will be called and where to put it. In the below image I name the new directory uitk, short for Urban Informatics Toolkit, and place it in the directory R. Be sure to select which folder you want your project to live in.
A few tips:
- Think about where you will be able to find the project again.
-
Do not put spaces or periods in the directory name. Use
_or-if you feel the need.
This will open up a new RStudio session. You will notice in your Files pane that there is now a uitk.Rproj file there. That file is what tells RStudio about the project, so don’t delete it! If you would like to open up an RStudio project you can either open the .Rproj file from your file navigator or by following File > Open Project.
6.4.2 The data
In order to complete the exercises throughout this book you will need to have the data accessible to you. You can download the it here.37 This link will download a file called data.zip. Once downloaded open the file. It will create a folder called data. Move that entire folder into your new project. If you created a project called uitk in the R directory, move the folder to ~/R/uitk. This will create a folder path of ~/R/uitk/data.
6.4.3 Your Workspace
In another effort to impose good habits and reproducibility standards I will suggest you change one setting in RStudio. Navigate to Tools > Global Options and change the below setting.
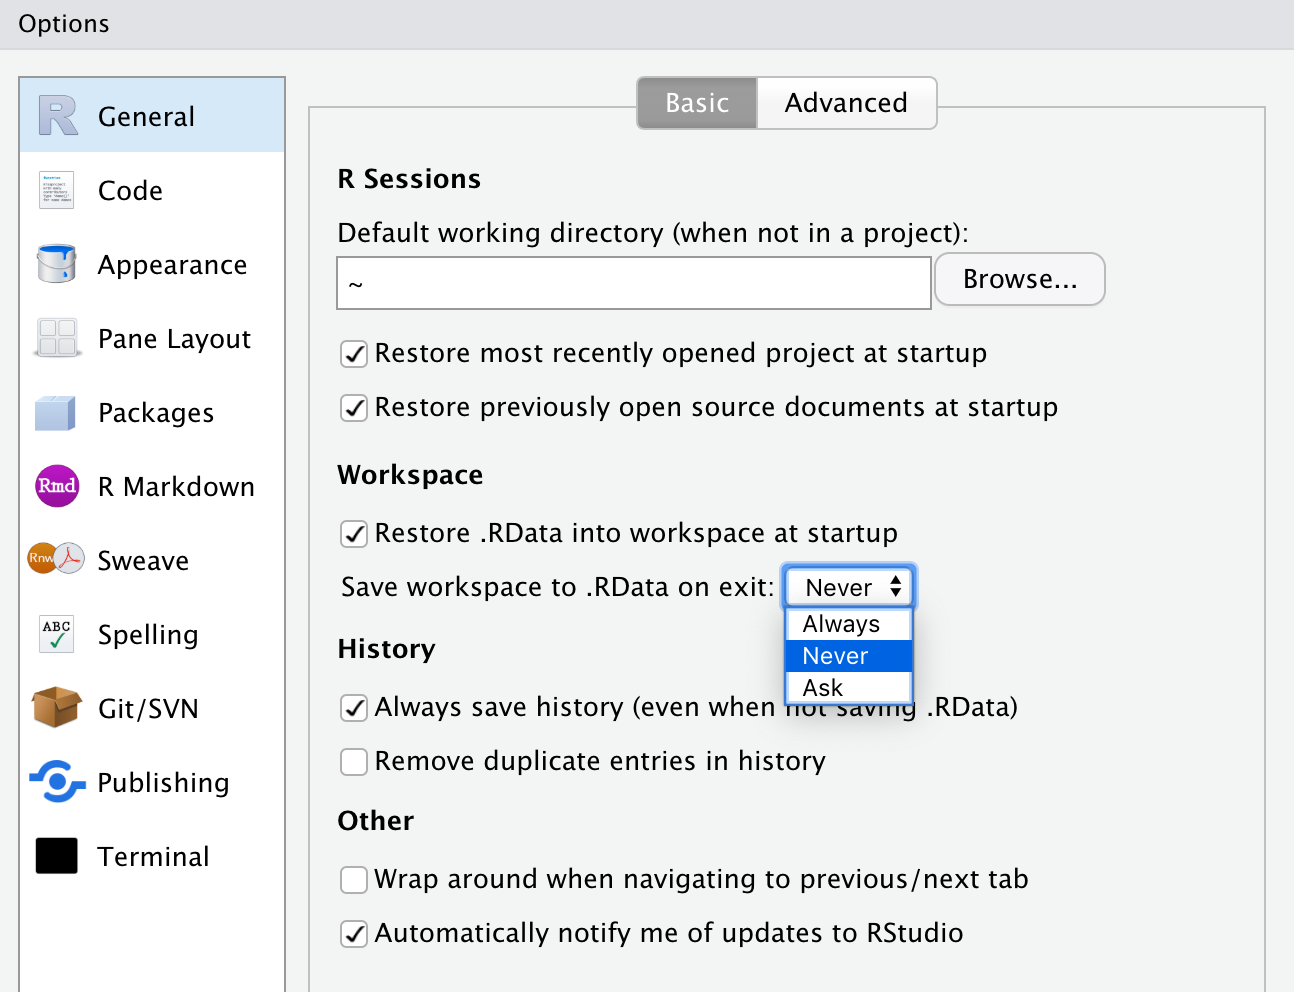
This setting makes it so that your analysis is dependent upon the code you write, not the data objects you create while interactively programming. A general rule of thumb is that your R script should be able to run from top to bottom successfully.
6.5 Before we embark
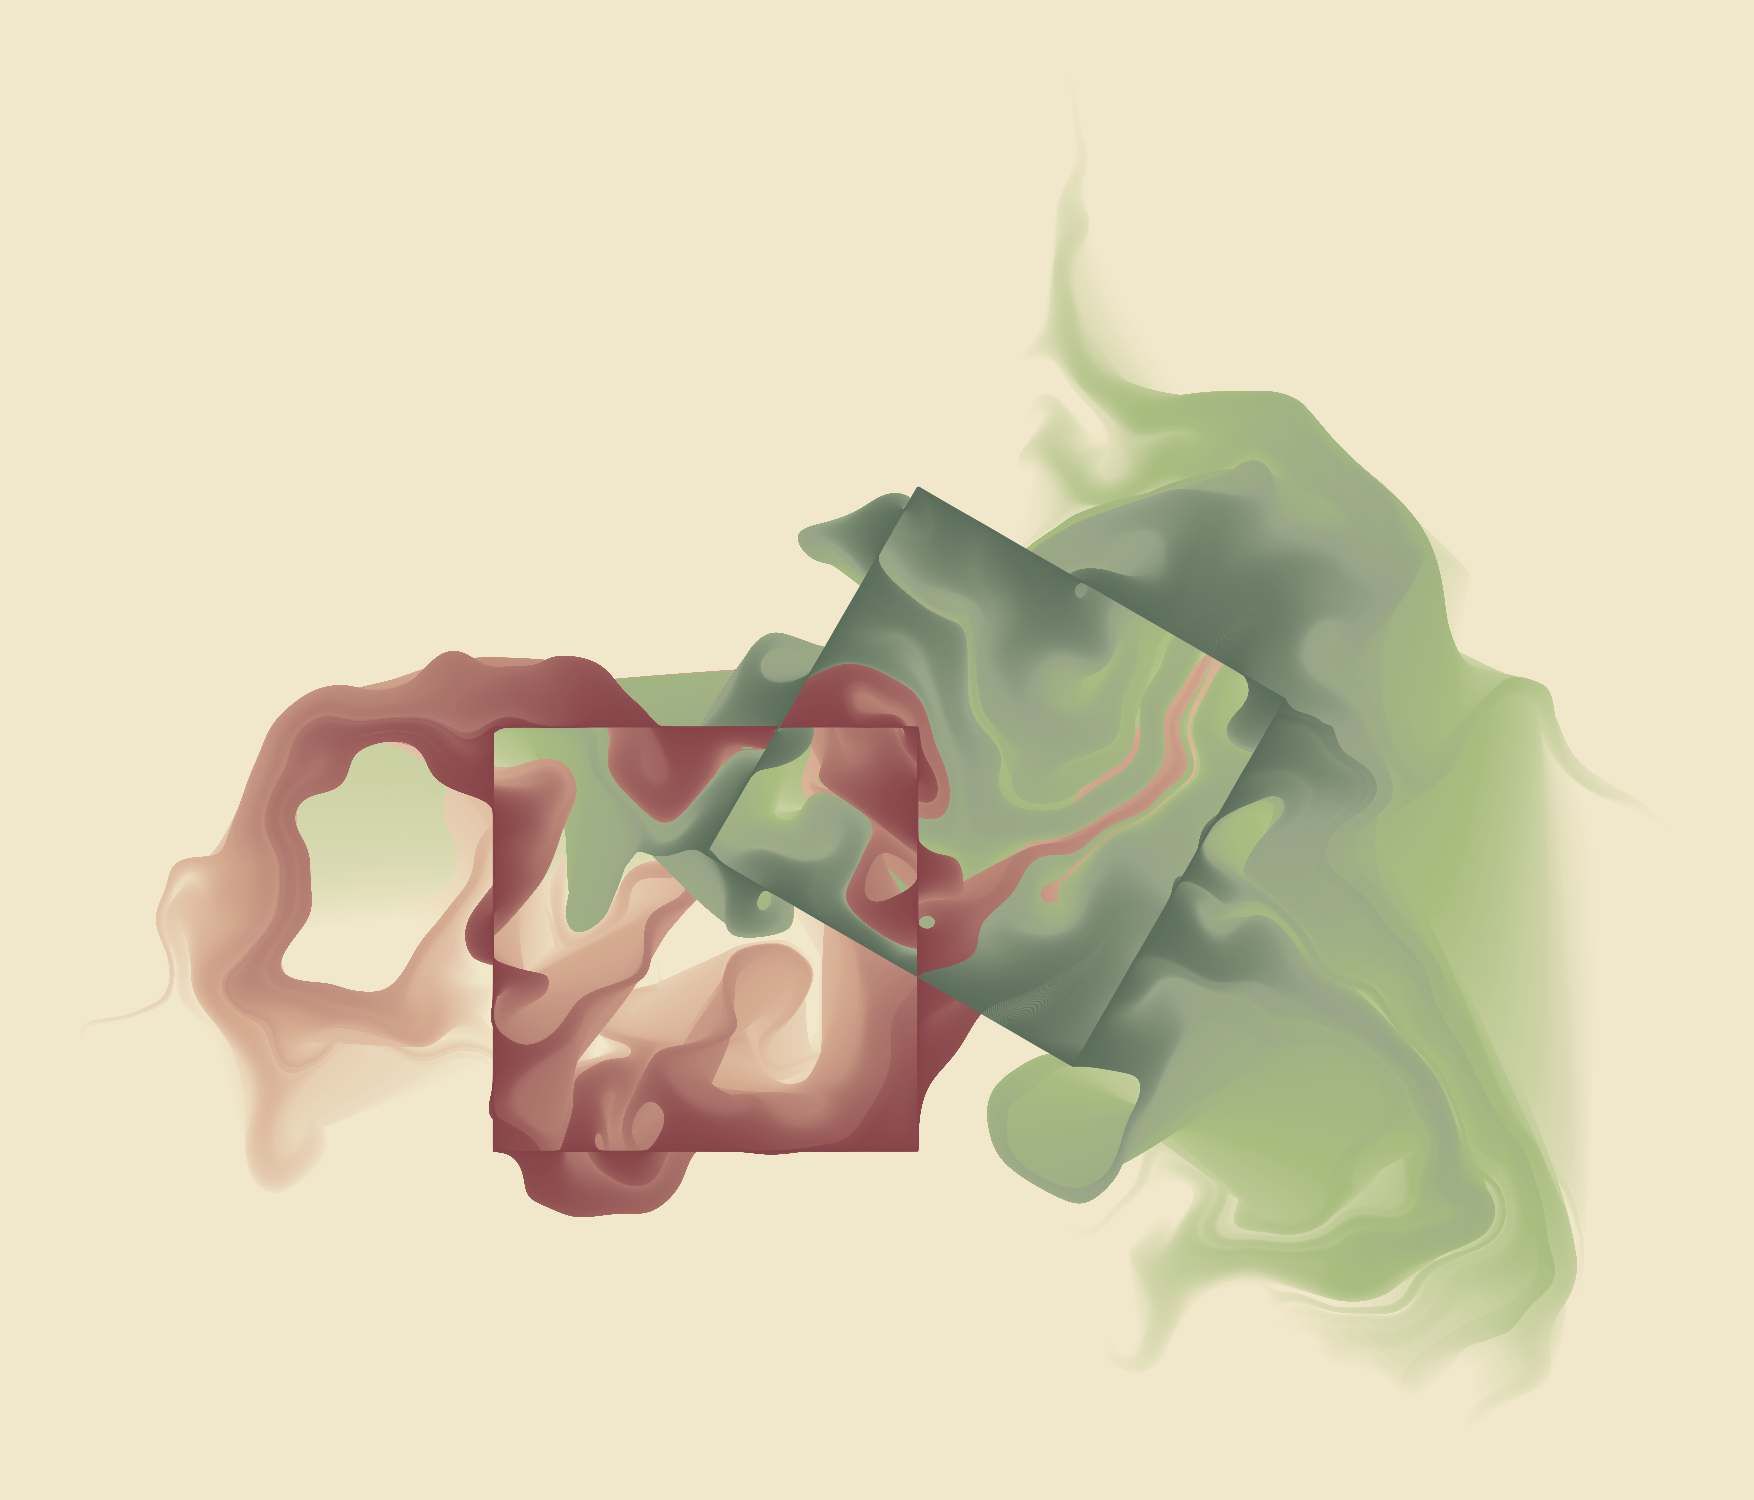
Lastly, I want to emphasize that R and RStudio can be used for so much more than statistical analysis. They can be used to make art.
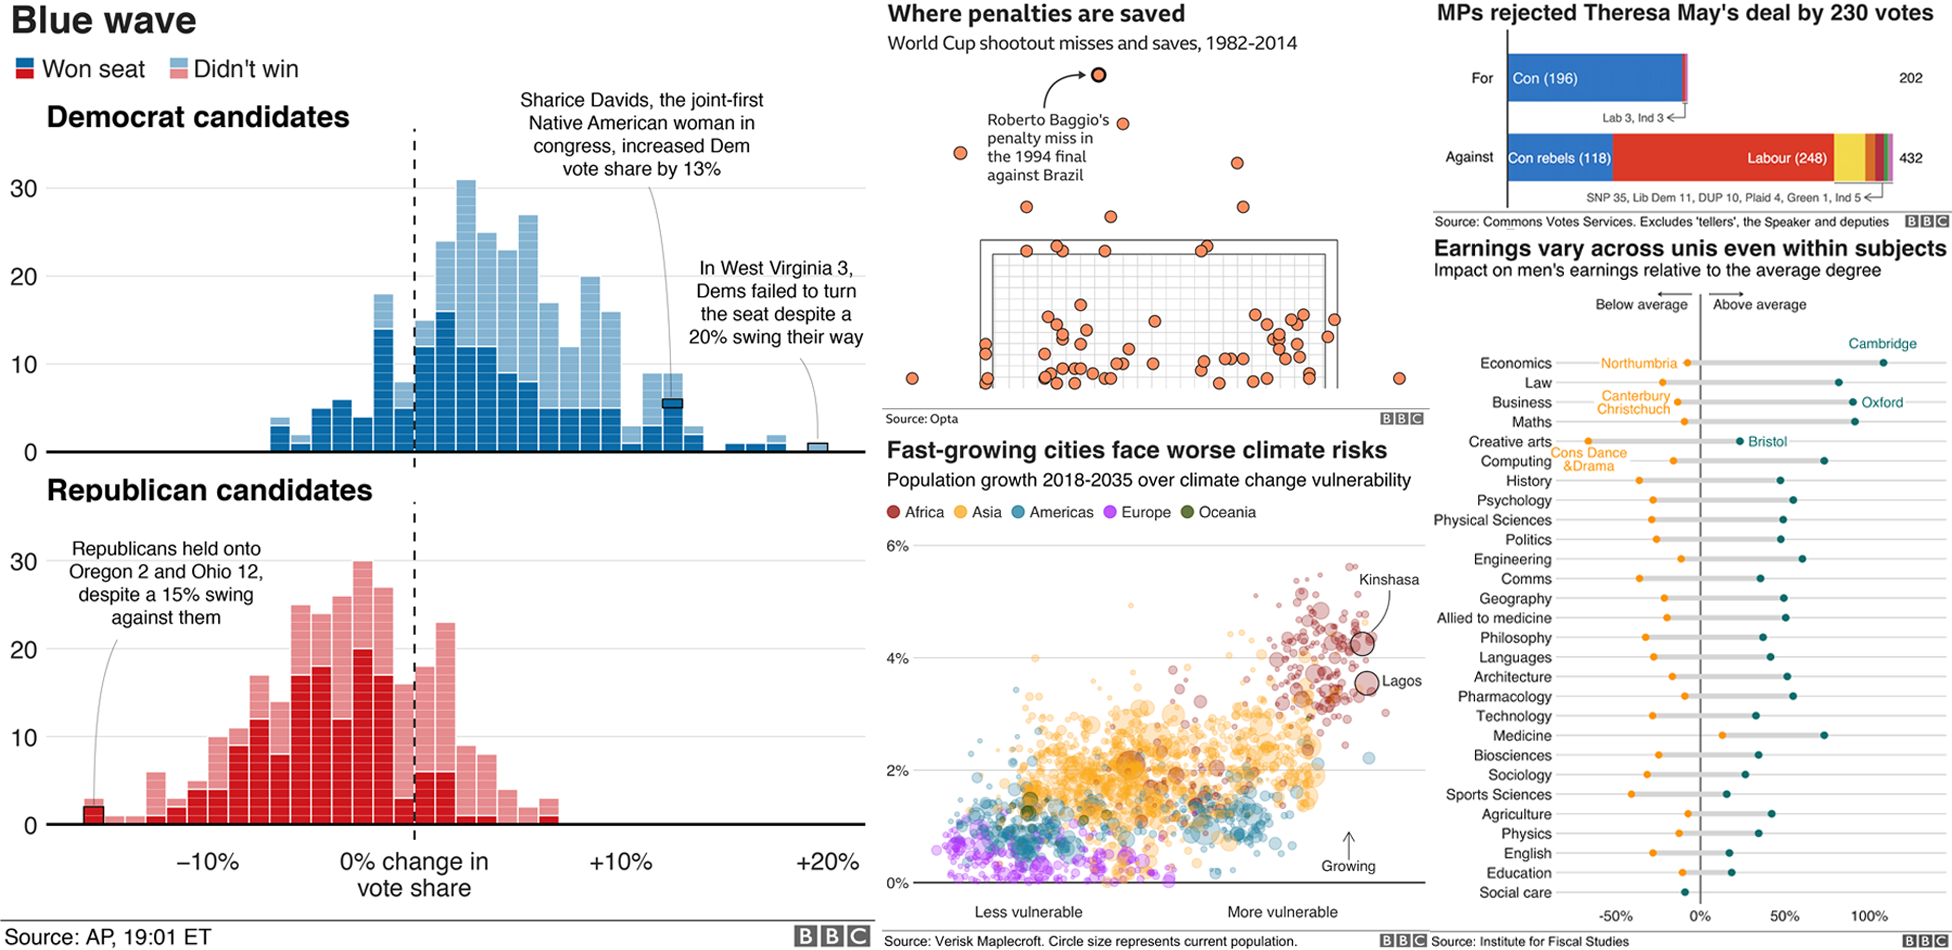
They can be used to make beautiful graphics for the BBC.
R can be found in the infrastructure of our modern world. R is utilized in our global financial institutions, civil rights groups such as the ACLU, investigative journalism, national defense, and so much more. Do not feel that the only thing you will get from learning R is how to do some simple statistics.
6.6 Getting Help
You may run into problems and you may want some help. If you don’t know where to go, getting help may feel impossible. There are two main places that I recommend: Stack Overflow and RStudio community.
Stack Overflow is one piece of the large Stack Exchange network that is dedicated strictly to programming issues.38 Stack Exchange is a network strictly dedicated to a question and answer format. Each topic has its own subdomain. For those who are unfamiliar, think of Stack Exchange like Reddit, Quora, or Yahoo! Answers.
The RStudio Community page is a community forum created by RStudio.39 This is a location for members of the R community—including you—to ask questions, engage in thoughtful dialogue, and much more. While Stack Overflow is committed to all programming languages the RStudio Community is maintained entirely by R users.
If it’s your first time asking a technical question online, I would recommend the RStudio Community, as this group is generally more accessible to beginners. Before you do, be sure to create a reproducible example, called reprex for short, so that the community can best help you.40
6.7 Reminders
Learning to program can be difficult and frustrating. You will not understand everything immediately. Don’t get down on yourself. Take breaks and don’t push yourself too hard or be self-critical. Eat a healthy snack, go exercise, sleep, be social, or do whatever makes you happy and then come back. You will be much happier.
If you ever find yourself in a bout of programming-induced frustration, try one of the below:
- Drink water.
- Get some sleep. Without sleep you wil be running at 60% or less.
- Eat your greens.
- Shower. Feeling clean can change your perspective and approach.
- Get your blood flowing! Go for a walk. Do some squats or pushups.